Morphologieanalyse und Lexikonaufbau (9. Vorlesung)
Dozent: Gerold SchneiderNAME: Introduction to Statistics for Linguists
AIM: To give an outline of the theoretical background of statistics for computational linguists, with a practical example of a descriptive linguistic test and the fundamental ideas of information theory, on which e.g. statistical taggers are based.
TOC:
CLAIM: Statistical methods are vital in quantitative linguistics. Although the host of theoretical background involves complicated mathematics, the usage of the tools most relevant to linguistics, e.g. standard deviation or the c2 test, are relatively simple. While information theory is the major method for staistical NLP, its central assumpitions are foreshadowed in the Zipf's laws.
FRAME: Literature:
GAME: Let's start!
Qualitative vs. quantitative linguistics
- quantitative measures:
gradable: 1.71 m, 3h, etc.
- qualitative measures:
features: [+female], [-Verb], etc.
Frequencies of features can be expressed in a ratio
mean: what we usually mean by "average". mean(1,5,6)=4. Equal area on both sides.
mode: the value which is most frequent. mode (1,1,4,6)=1. Peak in distribution graph.
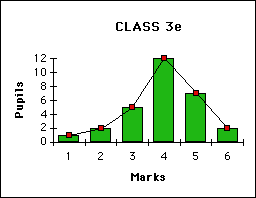
Suppose we want to illustrate test marks with a bar-graph:
We can easily draw similar distribution graphs for e.g.
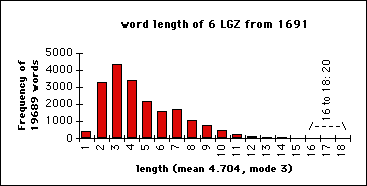
- word lengths (in letters) in 6 "London Gazettes" of 1691:
- The weight of UK citzens (a sample of 1000 arbitrarily chosen people).
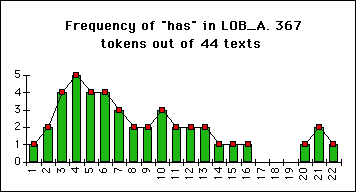
- Frequencies of "has" in the 44 texts of LOB Category A (Press:reviews):
etc.
In these cases, you will get charts which more or less resemble to the so-called normal distribution:
In many other cases, you will not get a normal distribution. While we often expect normal distribution in qualitative measures, we often expect an even distribution in quantitative measures.
Q1: Suggest a distribution graph for "Time needed to travel between home and work per day" on a scale of 0 to 3 hours.
Q2: Suggest a distribution graph for "Height of people" on a scale of 0 to 3m.
Q3: Compare the two graphs.
Even if results may have similar mean, median or mode, the dispersion may vary greatly. Consequently, comparing average values only is at best a hint at statistical peculiarities, but no reliable tool or even a "proof" of any theory. [Butler 68-9]: "If we have demonstrated a difference in, say, the means or medians for two sets of data, can we not just say that one is indeed greater than the other, and leave it at that? This would, in fact, be most unwise, and would show a lack of understanding of the nature of statistical inference."
Measures of dispersion needed:
First idea: Sum of differences from mean: [Woods/Fletcher/Hughes 41]
-> positives and negatives cancel each other out. The result is always ZERO!
Better idea: Sum of squared differences
-> renders positive values for each token
-> weighs strong deviations more heavily.
The sum of the squared differences, divided by the number of tokens (minus one) is the variance:
It is useful to use s instead of s2. s is called the Standard Deviation:
The standard deviation tells us how much any token deviates on average=how much we can expect a token to deviate. E.g. we want to add one more token to our sample. We can expect it to deviate by the standard deviation s.
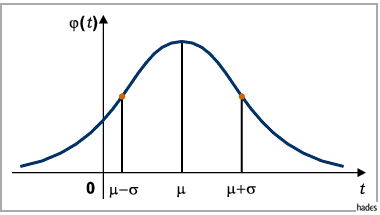
In a PERFECT normal distribution 68% of all sample values lie within x-bar and x-bar ±s, =within the mean plus or minus the standard deviation, while 95% of all values lie within x-bar ± 2s. But most real distributions look more or less different from the PERFECT normal distribution, so these percentages vary accordingly. If for any particular value x we want to find out how much it deviates from the mean x-bar in relation to the standard deviation, we simply devide x minus x-bar by s.
(4) 
This is the so-called z-score. For x = x-bar + s z is e.g. 1.
An easy way to express the amount of dispersion of a distribution graph is to calculate the standard deviation in relation to the mean, i.e. calculating a relative standard deviation, which is a coefficient, a ratio, i.e. it can be expressed in percents (thus x 100% in formula (4)). This percentage, called the variation coefficient, conveys how many percents of the mean is the standard deviation.
By comparing on the one hand the averages (mean, mode and median) and on the other hand the standard deviations of two sets of data, we already get a much clearer picture whether differences between them are statistically relevant or not. But still, because real distibutions differ from the perfect normal distribution, they do not deliver reliable data. A simple test of "how normal" a distribution is consists in calculating the mean, the median and the mode. Since they coincide in a perfect normal distribution, the amount of their differences gives a (very) rough idea of how closely a distribution is "normal".
In a perfect normal distribution, 95% of all values lie within x-bar ± 2s. A value value outside this interval (95% is a common confidence interval) can be said to be statistically "abnormal".
Since we often want to compare sets of data, and since most distribuitions are not perfectly normal, different tests are needed. They exist in fact, one of them is the chi-square test.
When can a feature be said to be statistically relevant?
What we want to know in descriptive linguistics (for sociolinguistic studies, etc.) is not the amount of differences between two observable sets, but the PROBABILITY of observing them. E.g. normal distribution, two events (like coin-tossing) with equal probability.
HEAD: 1/2        HEAD, followed by HEAD: 1/2 x 1/2=1/4 etc.
TAIL: 1/2        TAIL, followed by TAIL: 1/2 x 1/2=1/4 etc.
Let us name the probability of HEAD as h and the probability of TAIL as t.
Tosses:S(p) Probabilites=Binomials:              Pascal - Triangle  p(1)=1/q

1      1 =  (h+t) = h+t                                1  1              2=q
2      1 =  (h+t)2= h2+2ht+t2                          1  2  1            4=q
3      1 =  (h+t)3= h3+3h2t+3ht2+t3                   1  3  3  1           8=q
4      1 =  (h+t)4= h4+4h3t+6h2t2+4ht3+t4            1  4  6  4  1         16=q
5      1 =  (h+t)5= h5+5h4t+10h3t2+10h2t3+5ht4+t5   1  5 10  10  5 1       32=q
X      1 =  (h+t)X= ...                                 ...              2X=q
This is indeed the mathematical model of the normal distribution!
If for example we want to test how normal our sampled data is, we need to compare it with such a model, hoping the data will match it closely. Or if we want to show that our data is NOT normally distributed, it has to match as little as possible. Obviously such tests involve complex mathematics. Fortunately, charts with results are available; so we do NOT have to bother about mathematical issues too much.
Test for fit of data                          Test of statistical
to a model or theory               vs.        relevance of a discrepancy

                                 CLAIM:

The probability of achieving                  The probability of achieving
the ACTUAL distribution of data               the ACTUAL distribution of data
is very high (> 95%)                          is very low (< 5%)

                               PROCEDURE:

"prove" that the null-hypothesis              "prove" that the null-hypothesis
does apply                                    does NOT apply
The null-hypothesis suggests that the devations and fluctuations in our data are due to chance, the small sample size, or insufficent care in selecting our sample, and that consequently our data is indeed very probable. [Butler 69-70]
Number of groups: We need to divide our data into appropriate intervals. In order to attain a represenation which can resemble to a normal distribution, you need at the very least 3, but better at least 6 intervals. The c2 test needs at least two intervals.The more intervals you make, the more data you need, to avoid gaps and fluctuations. It is hardly useful to make more than 20 intervals.
Number of values per group: Groups with very low values cannot yield reliable statistical information. This is the so-called sparse data problem. For e.g. the c2 test every interval must contain at least 5 values. "Border intervals" may be collapsed. (cf. ill. C.2).
Number of total values: From the above it follows that the c2 test needs at the very least 10 samples to work. [Woods/Fletcher/Hughes103].
The following remarks refer to the c2 test, the only test I intend to introduce here.
Ad Graph (A): 29 pupils, barely enough to make 3 groups. The result will not be very reliable, but still valid. Including one or two more classes recommended.
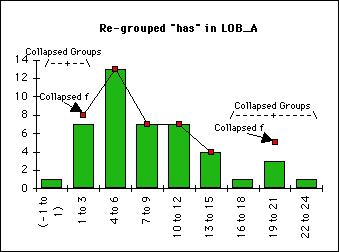
Ad Graph (B): Fine. Groups 16 to 18 are collapsed, then containing 20 values.
Ad Graph (C): Re-grouping necessary, 1 new group containing three others. One text did not contain any "has". This fact should also be included in the chart. This entails collapsing the first two groups, as well. Sampling more data (e.g LOB B&C, Brown A, or collecting "has"/1000 words instead of "has"/text @ 2000 words) would be nice, but not necessary. The re-grouped graph:
Threre is a big variety of statistic tests, the c2 test just one of them, perhaps not always the best suitable, but probably the most universal one.
Its principle: Compare (i.e. calculate the difference) the value of each interval with its corresponding expected value (from a "standard"). In order to eliminate negative values, and in order to count big aberrations more strongly, we square this difference (similar to standard deviation: x minus x-bar). We do not want to know the absolute difference, but the one relative to the height of the bar, so we divide it all by the expected value. Like for the standard deviation, we then add up all the values. In a formula (o=observed value, e=expected value, df+1=number of intervals):
The total deviance SD does not yet convey information on significance directly. SD is further processed by a complex probabilistic calculation, whose results are compiled into charts much easier to handle.
- in p=95% for proving the null-hypothesis: if SD < v then accept the null-hypothesis.
- in p= 5% for refuting the null-hypothesis: if SD > v, then refute the null-hypothesis.
Degrees of Freedom (df): Generally the number of groups minus 1. [Woods/Fletcher/Hughes 138]: "[T]he degrees of freedom can be considered in a sense as the number of independent pieces of information we have on which to base the test of a hypothesis". In contingency tables the df is: (number of columns -1) x (number of rows-1).
a standard may be:
- a theoretical model:e.g. the normal distribution, which is then a very accurate test for normality:
Calculate the appropriate standard values e:
- other sampled data, the bigger the better. In this case, contingency tables, a special variant of the c2test, are especially suitable. [Woods/Fletcher/Hughes 140]. Because this situation of qualitative measure is tvery frequent in linguistics, I am going to base my first practical example on it.
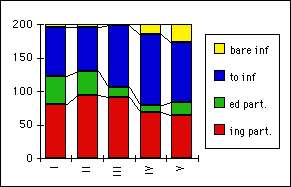
Returning to our discussion from the last lecture about the nominal/verbal character of Scientific English, we can now test if our findings are statistically relevant or a chance fluctuation.
The contingency table at the bottom of this chart sums up the nominal and the verbal categories. Let us assume that we simply want to compare the relation of all nominal categories (nouns, pronouns) to all verbal categories (main, verbs, auxiliaries, modals).
VALUES FROM LOB
ABS(K)
ABS(J)
Tag
294
1472
_BE
274
584
_BED
1000
1127
_BEDZ
46
149
_BEG
104
14
_BEM
172
480
_BEN
155
1007
_BER
328
2486
_BEZ
223
159
_DO
167
75
_DOD
37
108
_DOZ
279
595
_HV
791
343
_HVD
29
64
_HVG
21
23
_HVN
81
469
_HVZ
1033
2135
_MD
12
56
_NC
7130
26933
_NN
2055
9897
_NNS
9
775
_NNU
2
9
_NP
79
147
_NR
1
5
_NRS
249
159
_PN
3180
2585
_PP
1761
563
_PPA
531
755
_PPAS
124
110
_PPL
48
81
_PPLS
819
113
_PPO
234
205
_PPOS
2484
4024
_VB
2820
1363
_VBD
987
1491
_VBG
1375
5284
_VBN
151
1449
_VBZ
ABS(K)
ABS(J)
Tag
29085
67294
All of the above
56853
154691
All words
for chi-square Test:
Contingency Table
with absolute values:
OBSERVED:
Totals
N&Pro
16234
42393
58627
All Verbs
12851
24901
37752
Verbs&N&Pro
29085
67294
96379
All Words
56853
154691
211544
V&N&P/All Words
51.16%
43.50%
EXPECTED: (Row total * Column total)/Grand total
N&Pro
17692
40935
All Verbs
11393
26359
Verbs&N&Pro
29085
67294
(O-E)
N&Pro
-1458
1458
All Verbs
1458
-1458
(O-E)^2 / E
N&Pro
120
52
All Verbs
187
81
TOTAL= Chi-Square Value:
439
Look up in chart or use a probablity program
Probability at df=1
< 0.1%
Information Theory is used in many CL context, e.g. tagging.
The term "information" is understood as a measure of rarity, unexpectedness and uncertainty.
Let us look at a short conversation between A and B:
A1: Hello!
B1: Oh, hi!
A2: How are you?
B2: Fine, and you?
A3: Great, I have just been on holidays!
B3: Holidays? Lucky you! Where to?
A4: O, to the Mediterranean.
B4: Loads of sunshine ...
A5: You can count on that!
B5: Well ... I've got to move on ...
    Are you in tomorrow for a cup of vodka?
A6: That would be great!
B6: Fine. See you then!
A7: See you!
At which places are there many options, are we thus uncertain how the conversation could go on? --> Entropy
Where do we encounter an unexpected, unlikely statement? --> Rareness, Mutual Information
Entropy is generally a measure of randomness in nature, which is also used in natural science. Entropy is low in situations where probabilites are very unequal. E.g. a greeting is usually answered by a greeting; A1 to B2 contain virtually no information, as we expect this continuation of the conversation. In situations where there are many possibilities of equal probabilities, such as after the "great" in A3, entropy is very high. In this sense, the utterance that A was on holidays has a very high information content.
Where entropy and thus information is low, mutual information (MI) between two succeeding units is high. While the word "Mediterranean" is generally infrequent and thus informative, the "holidays" context renders it much less informative and unlikely.
p("Meditarranean") < p("Mediterranean"|"holidays")On the other hand, the "vodka" comes as a surprise in the "cup" context. Perhaps "vodka" is rarer in this context than in general language - although this a hypothesis one would have to prove:
p("vodka") > p("vodka"|"cup") ?On the word level, the transition between "cup" and "of"
p("of"|"cup")is likely, MI thus high, the transition from "of" to "vodka"
p("vodka"|"of")more unlikely, but the collocation of "cup" and "vodka"
p("vodka"|"cup")is most unlikely - there is hardly any or no MI.
On the POS level, all the transition probabilities p(ni|ni-1)are relatively high, however.
p(N|PREP), p(PREP|N)
p(A|B) is the relative or conditional probability of event A GIVEN event B, i.e. the probability of A if we already know that B. Relative probabilities are used in Bayesian statistics, on which most statistical NLP approaches rely.
While this formula is not easily provable it can be shown that p(A|B) depends on p(A « B) and p(B).
If p(A « B) is bigger while p(B) remains constant, then p(A|B) increases (positive correlation), there is more mutual information, A and B are more dependent on each other.
If p(B) is bigger while p(A « B) remains constant, then p(A|B) decreases (negative correlation), there are more B cases which are not in A, which decreases the dependency of B on A and thus the mutual information.
We have seen uses of conditional probabilities for hidden Markov models in the lecture on statistical taggers.
In case it is easier to determine p(B|A) instead of p(A|B) the order of dependence is related to its opposite by means of the Bayes' theorem:
Information theory was developped in the 1940s by Claude Shannon in order to calculate maximally efficient compression algorithms for sending data over slow telephone lines. Entropy, the measure of unexpectedness and information of a random variable is normally measured in bits in Computing Science. In order to transmit the outcome of rolling a regular 8-sided die, 3 bits of information are necessary:
1    2    3    4    5    6    7    8
001  010  011  100  101  110  111  000
If, however, certain outcomes or patterns of the language to be transmitted are frequent, then they should be represented by the shortest bit-sequence possible for an optimal data compression. Also modern data compression algorithms are still based on this simple idea. In a (simplified) version of Polynesian, only 6 letters are known, with the following frequencies:
p    t    k    a    i    u
1/8  1/4  1/8  1/4  1/8  1/8
The letter entropy is 2.5 bits. In order produce the shortest possible encoding, the frequent letters are given 2-bit codes, the others 3-bit codes:
p    t    k    a    i    u
100  00   101  01   110  111
As 2-bit codes begin with 0 and 3-bit codes with 1, decoding is never ambiguous.
Zipf's laws, which state that
- the most frequent words are shortest
- the most frequent words are most ambiguous (but humans can easily disambiguate them in context)
- wordlist rank * frequency is constant, i.e. the most frequent words are extremely frequent and the most expressive (informative!) ones very rare
are in full agreement with information theory, almost a consequence of it.